Home > Blog > Stock Market > A Comprehensive Guide to Technical and Fundamental Analysis in Online Trading
Stock Market
Feb 15, 2024
In the fast-paced world of financial markets, making informed decisions is critical for successful trading. To achieve this, investors rely on two primary methods of analysis: technical analysis and fundamental analysis. In this blog, we will delve into the basics of both techniques and explore how they can be utilized to make informed decisions while utilizing online trading accounts with zero brokerage and no opening fees.
Technical analysis involves studying historical price and volume data of a security to forecast its future price movements. The underlying philosophy of technical analysis is that historical price patterns tend to repeat, allowing traders to identify trends and potential reversal points. Key concepts in technical analysis include:
Candlestick Charts: Candlestick charts represent price movements over a specific period, revealing valuable information about the market sentiment and trends.
Trend Lines: Trend lines help traders identify the direction of the market and potential support and resistance levels.
Support and Resistance: Support refers to the price level where a downtrend can be expected to pause due to a concentration of demand, while resistance represents a price level where an uptrend can stall due to an abundance of supply.
Technical Indicators: There are numerous technical indicators, such as Moving Averages, Relative Strength Index (RSI), Moving Average Convergence Divergence (MACD), and Bollinger Bands, which assist traders in understanding the market momentum and potential entry and exit points.
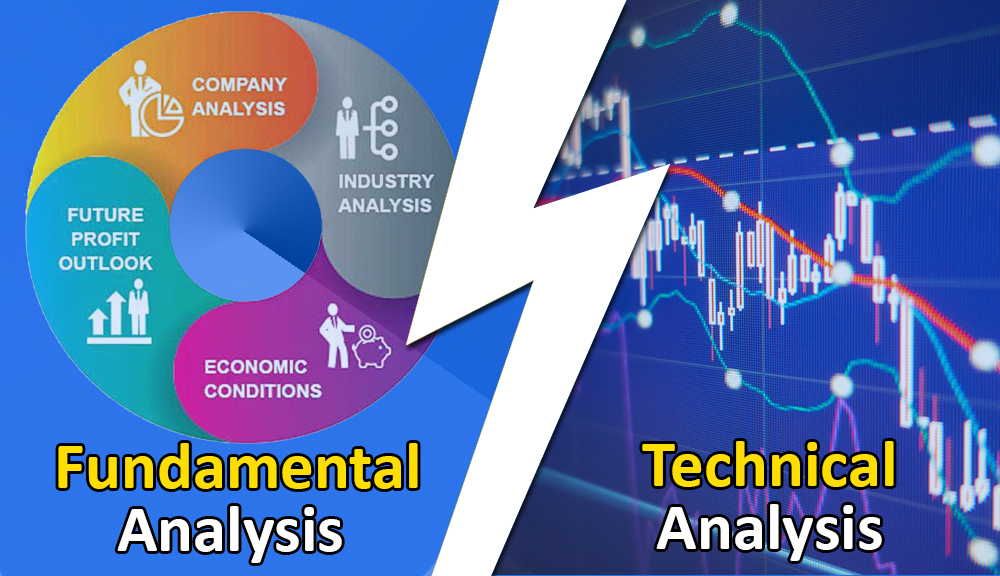
Fundamental analysis focuses on evaluating the intrinsic value of a security by analysing various economic, financial, and other qualitative and quantitative factors. The goal is to determine whether the asset is undervalued or overvalued and make investment decisions accordingly. Key aspects of fundamental analysis include:
Financial Statements: Analysing a company's balance sheet, income statement, and cash flow statement helps assess its financial health and performance over time.
Economic Indicators: Keeping track of macroeconomic indicators like GDP growth, inflation rates, and employment data can offer insights into the overall health of the economy.
Industry Analysis: Understanding the dynamics of the industry in which a company operates can provide context for its performance and growth prospects.
Company Management: Evaluating the competency and track record of the company's management team is crucial in predicting its future success.
Technical indicators play a vital role in guiding trading decisions. Let's explore some common technical indicators and their applications:
Moving Averages (MA): MAs smooth out price data, providing a clearer picture of the underlying trend. Traders often use the crossover of short-term and long-term MAs as potential entry and exit signals.
Relative Strength Index (RSI): RSI measures the speed and change of price movements, helping identify overbought or oversold conditions. A reading above 70 suggests overbought, while below 30 indicates oversold.
Moving Average Convergence Divergence (MACD): MACD combines two moving averages to generate signals when the shorter-term MA crosses above or below the longer-term MA, indicating potential trend changes.
Bollinger Bands: Bollinger Bands consist of a moving average and two standard deviation lines. They help identify price volatility and potential reversal points.
Fibonacci Retracement: Traders use Fibonacci levels to identify potential support and resistance levels based on the principle that markets tend to retrace a portion of their previous moves.
In conclusion, both technical and fundamental analysis are powerful tools that can aid investors in making well-informed decisions while trading through online platforms. By understanding the basics of technical analysis, including candlestick charts, trend lines, and various technical indicators, traders can identify potential entry and exit points. Meanwhile, fundamental analysis enables investors to assess the true value of a security by examining financial statements, economic indicators, industry trends, and management competency. By combining these analyses, traders can develop a comprehensive strategy to navigate the dynamic world of financial markets, leveraging zero brokerage demat accounts and free demat account opening offered by platforms like Dhani Stocks. Empowered with knowledge and research, investors can embark on their trading journey with confidence and a higher probability of success.